Preface
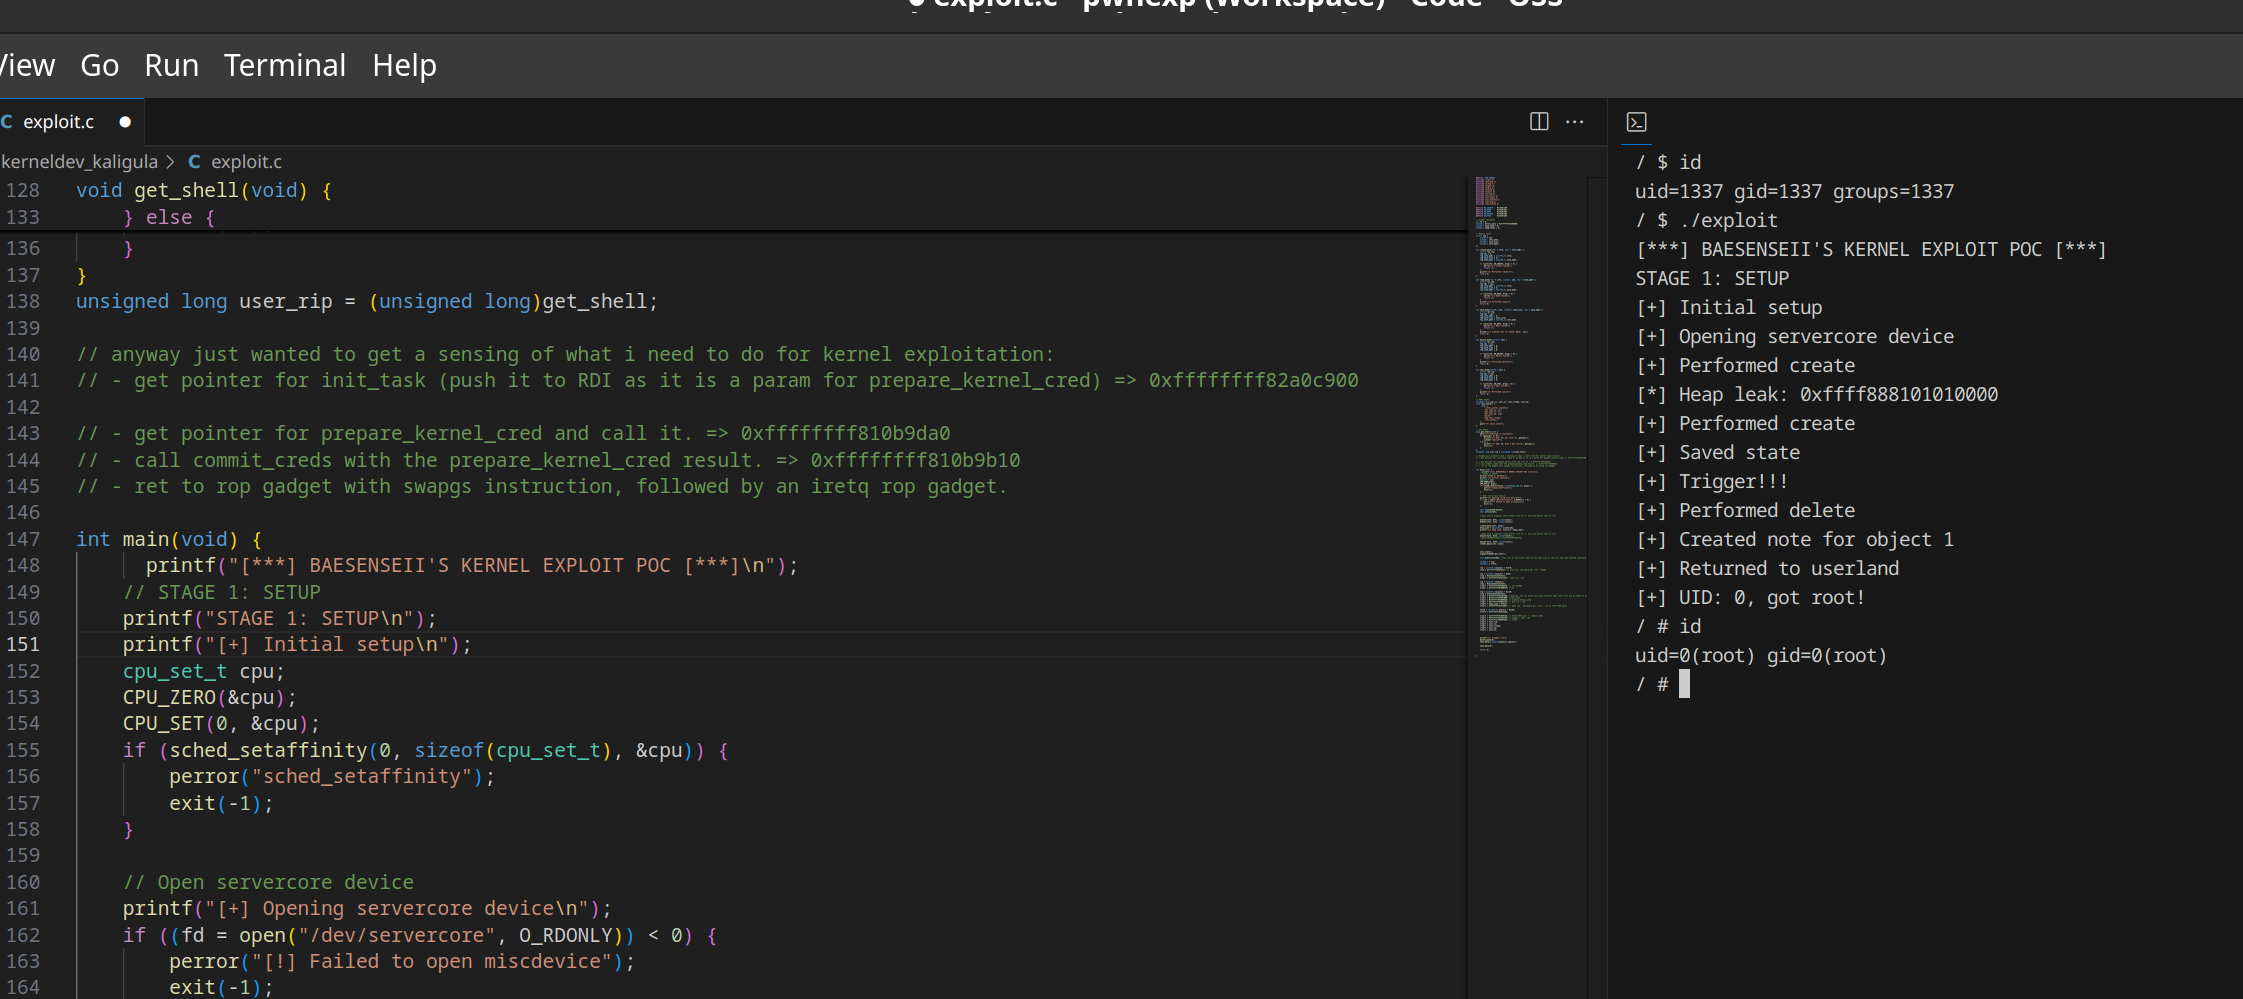
As some of you might already know by now, I have been taking quite a fair interest on doing pwn challenges in CTF as part of my goal to improve on my binary exploitation skills.
Back in Dec 2024, I’ve had the privilege to volunteer as a Teaching Assistant for the Advanced Youth Cyber Exploration Programme (AYCEP) which involved participants from various tertiary institutions and academia (JC/Secondary). More details on the programme can be found here: https://www.csa.gov.sg/our-programmes/talent-and-skills-development/sg-cyber-talent/sg-cyber-youth/advanced-youth-cyber-exploration-programme
Long story short, one of the modules covered in the programme was vulnerability research (in the area of binary and KERNEL exploitation), and by far this module destroyed like 99% of the participants (especially when kernelpwn was introduced). As much as the students were lost, I found it very intriguing to learn and started to deep dive into it more.
Kernel Exploitation
The Problem
During the programme, the qemu-system tool was used to help emulate kernel environments to run our exploits which were based on vulnerable Linux drivers that were already pre-built into the kernel. The main idea of this exploit is to escalate privileges from a low-privileged user to root privileges based on vulnerabilities identified in the driver (e.g Use-After-Free, Kernel-based Buffer Overflow attacks, etc).
Based on my experience just going through the labs, here are the things that I find it pretty troublesome and annoying to do:
-
The following tools need to be installed on the debugging system:
- musl-gcc ⇒ for compiling exploits
- qemu-system ⇒ for kernel environment emulation
- gdb ⇒ for kernel debugging (you can use pwndbg or even GEF, take your pick)
-
Every single time the exploit code (in C) is changed, it is required to compile the exploit
-
Next, the ‘exploit’ binary has to be placed inside the ‘initramfs.cpio.gz’ file, which contains all the necessary binaries that define the root filesystem when the kernel boots up.
-
As qemu-system has an in-built functionality to launch gdbserver for remote debugging (‘-s’) + pausing the kernel CPU before the remote debugging is established, due to (3), this will mean that i need to keep on rebooting the kernel after a new ‘initramfs.cpio.gz’ file is generated (which will be like, almost all the time whenever there’s a change in the exploit code).
-
Lately, Visual Studio Code has been my go-to editor due to the extensions (was actively creating Docker images for my teaching content in school), but I have been using it extensively for my exploit code (with the C/C++ intellisense capabilities). In addition I used the Integrated Terminal to run qemu-system and gdb, however it is extremely annoying to keep on launching new tabs and writing the commands again.
-
On top of all that, in the event whereby my debugging machine fails, I seriously do not want to do the installation and configuration of the tools again. -_-“
The Solution
The Setup
Do bear in mind that at the time of this documentation, this is all being done on a laptop running Manjaro Linux, along with Vagrant and Visual Studio Code installed. And that is pretty much it to be honest :)
I am sure of those professionals who read this blog will be like “ah this is such a newb setup”, but I am writing this blog post so that others who want to get started on kernel exploitation would be more motivated to think of ways that can help ease the process. :)
The 1337 scripts (sorta..)
Now for point 6, this is kind of a given. The best way to do this is to set up a debugging VM machine and then export it to an OVA file. However, in order to grant greater flexibility to customise the debugging VM machine, I would think the best way to do it is to use Vagrant (which has been a godsend for me ever since I used it for implementing my CTF infrastructures).
So here’s the Vagrantfile used to create my customisable debugging VM machine:
# -*- mode: ruby -*-
# vi: set ft=ruby :

Vagrant.configure("2") do |config|
  config.vm.box = "ubuntu/jammy64"
  config.vm.hostname = "pwnvm"

  config.vm.provider "virtualbox" do |vb|
    vb.memory = "4096"
  end
  config.vm.provision "shell", inline: <<-SHELL

  # Add Docker's official GPG key:
sudo apt-get update
sudo apt-get -y install ca-certificates curl net-tools
sudo install -m 0755 -d /etc/apt/keyrings
sudo curl -fsSL https://download.docker.com/linux/ubuntu/gpg -o /etc/apt/keyrings/docker.asc
sudo chmod a+r /etc/apt/keyrings/docker.asc

# Add the repository to Apt sources:
echo \
  "deb [arch=$(dpkg --print-architecture) signed-by=/etc/apt/keyrings/docker.asc] https://download.docker.com/linux/ubuntu \
  $(. /etc/os-release && echo "$VERSION_CODENAME") stable" | \
  sudo tee /etc/apt/sources.list.d/docker.list > /dev/null
sudo apt-get update

# install the necessary tools needed
sudo apt-get install -y docker-ce docker-ce-cli containerd.io docker-buildx-plugin docker-compose-plugin python3-pip gdb vim tmux qemu-system musl-tools

# add the vagrant account to allow access to docker without logging in as root.
sudo usermod -aG docker vagrant

# installing pwntools
sudo pip3 install --upgrade pip
sudo pip3 install pwntools

git clone https://github.com/pwndbg/pwndbg
cd pwndbg
sudo ./setup.sh
echo "source /home/vagrant/pwndbg/gdbinit.py" > /home/vagrant/.gdbinit

  SHELL
end
For steps 2,3 and 4, I have taken the liberty to create the following wrapper scripts:
- unzip_cpio.sh (only need to be run once) ⇒ Unzips the contents of the initramfs.cpio.gz file and places it in a newly created folder called ‘initramfs’:
#!/bin/sh
mkdir initramfs
cd initramfs
cp ../initramfs.cpio.gz .
gunzip ./initramfs.cpio.gz
cpio -idm < ./initramfs.cpio
rm initramfs.cpio
- recompile-exploit-run.sh ⇒ Performs the compilation of the exploit, loading it into the root filesystem folder before compressing it to ‘initramfs.cpio.gz’. In addition, the script will also attempt to emulate the kernel using Qemu with the necessary debugging options (note that as of now my environment has KASLR disabled. Typical kernel pwn environments would provide a run.sh to launch the environment with Qemu, so do adjust it accordingly):
#!/bin/sh

musl-gcc -o ./initramfs/exploit ./exploit.c -static

cd initramfs
find . -print0 | cpio -ov --format=newc --null | gzip -9 > ../initramfs.cpio.gz
cd ../

## If you want to enable debugging mode, uncomment this qemu-system code syntax.

# qemu-system-x86_64 -s -S \
#     -kernel ./bzImage \
#     -cpu qemu64,+smep,+smap \
#     -m 4G \
#     -smp 2 \
#     -initrd initramfs.cpio.gz \
#     -append "console=ttyS0 quiet loglevel=3 nokaslr kpti=1" \
#     -monitor /dev/null \
#     -nographic \
#     -no-reboot \

## If you want to disable debugging mode, uncomment this qemu-system code syntax.
qemu-system-x86_64 \
    -kernel ./bzImage \
    -cpu qemu64,+smep,+smap \
    -m 4G \
    -smp 2 \
    -initrd initramfs.cpio.gz \
    -append "console=ttyS0 quiet loglevel=3 nokaslr kpti=1" \
    -monitor /dev/null \
    -nographic \
    -no-reboot \
The Secret VSCode Weapon: tasks.json
Some of you might already know regarding Visual Studio Code having the Integrated Terminal, which allows users to interface with the Linux terminal without the need to launch the actual Terminal application. Being the lazy programmer that I am, I started to tinker with VSCode and I discovered this (https://code.visualstudio.com/docs/editor/tasks):
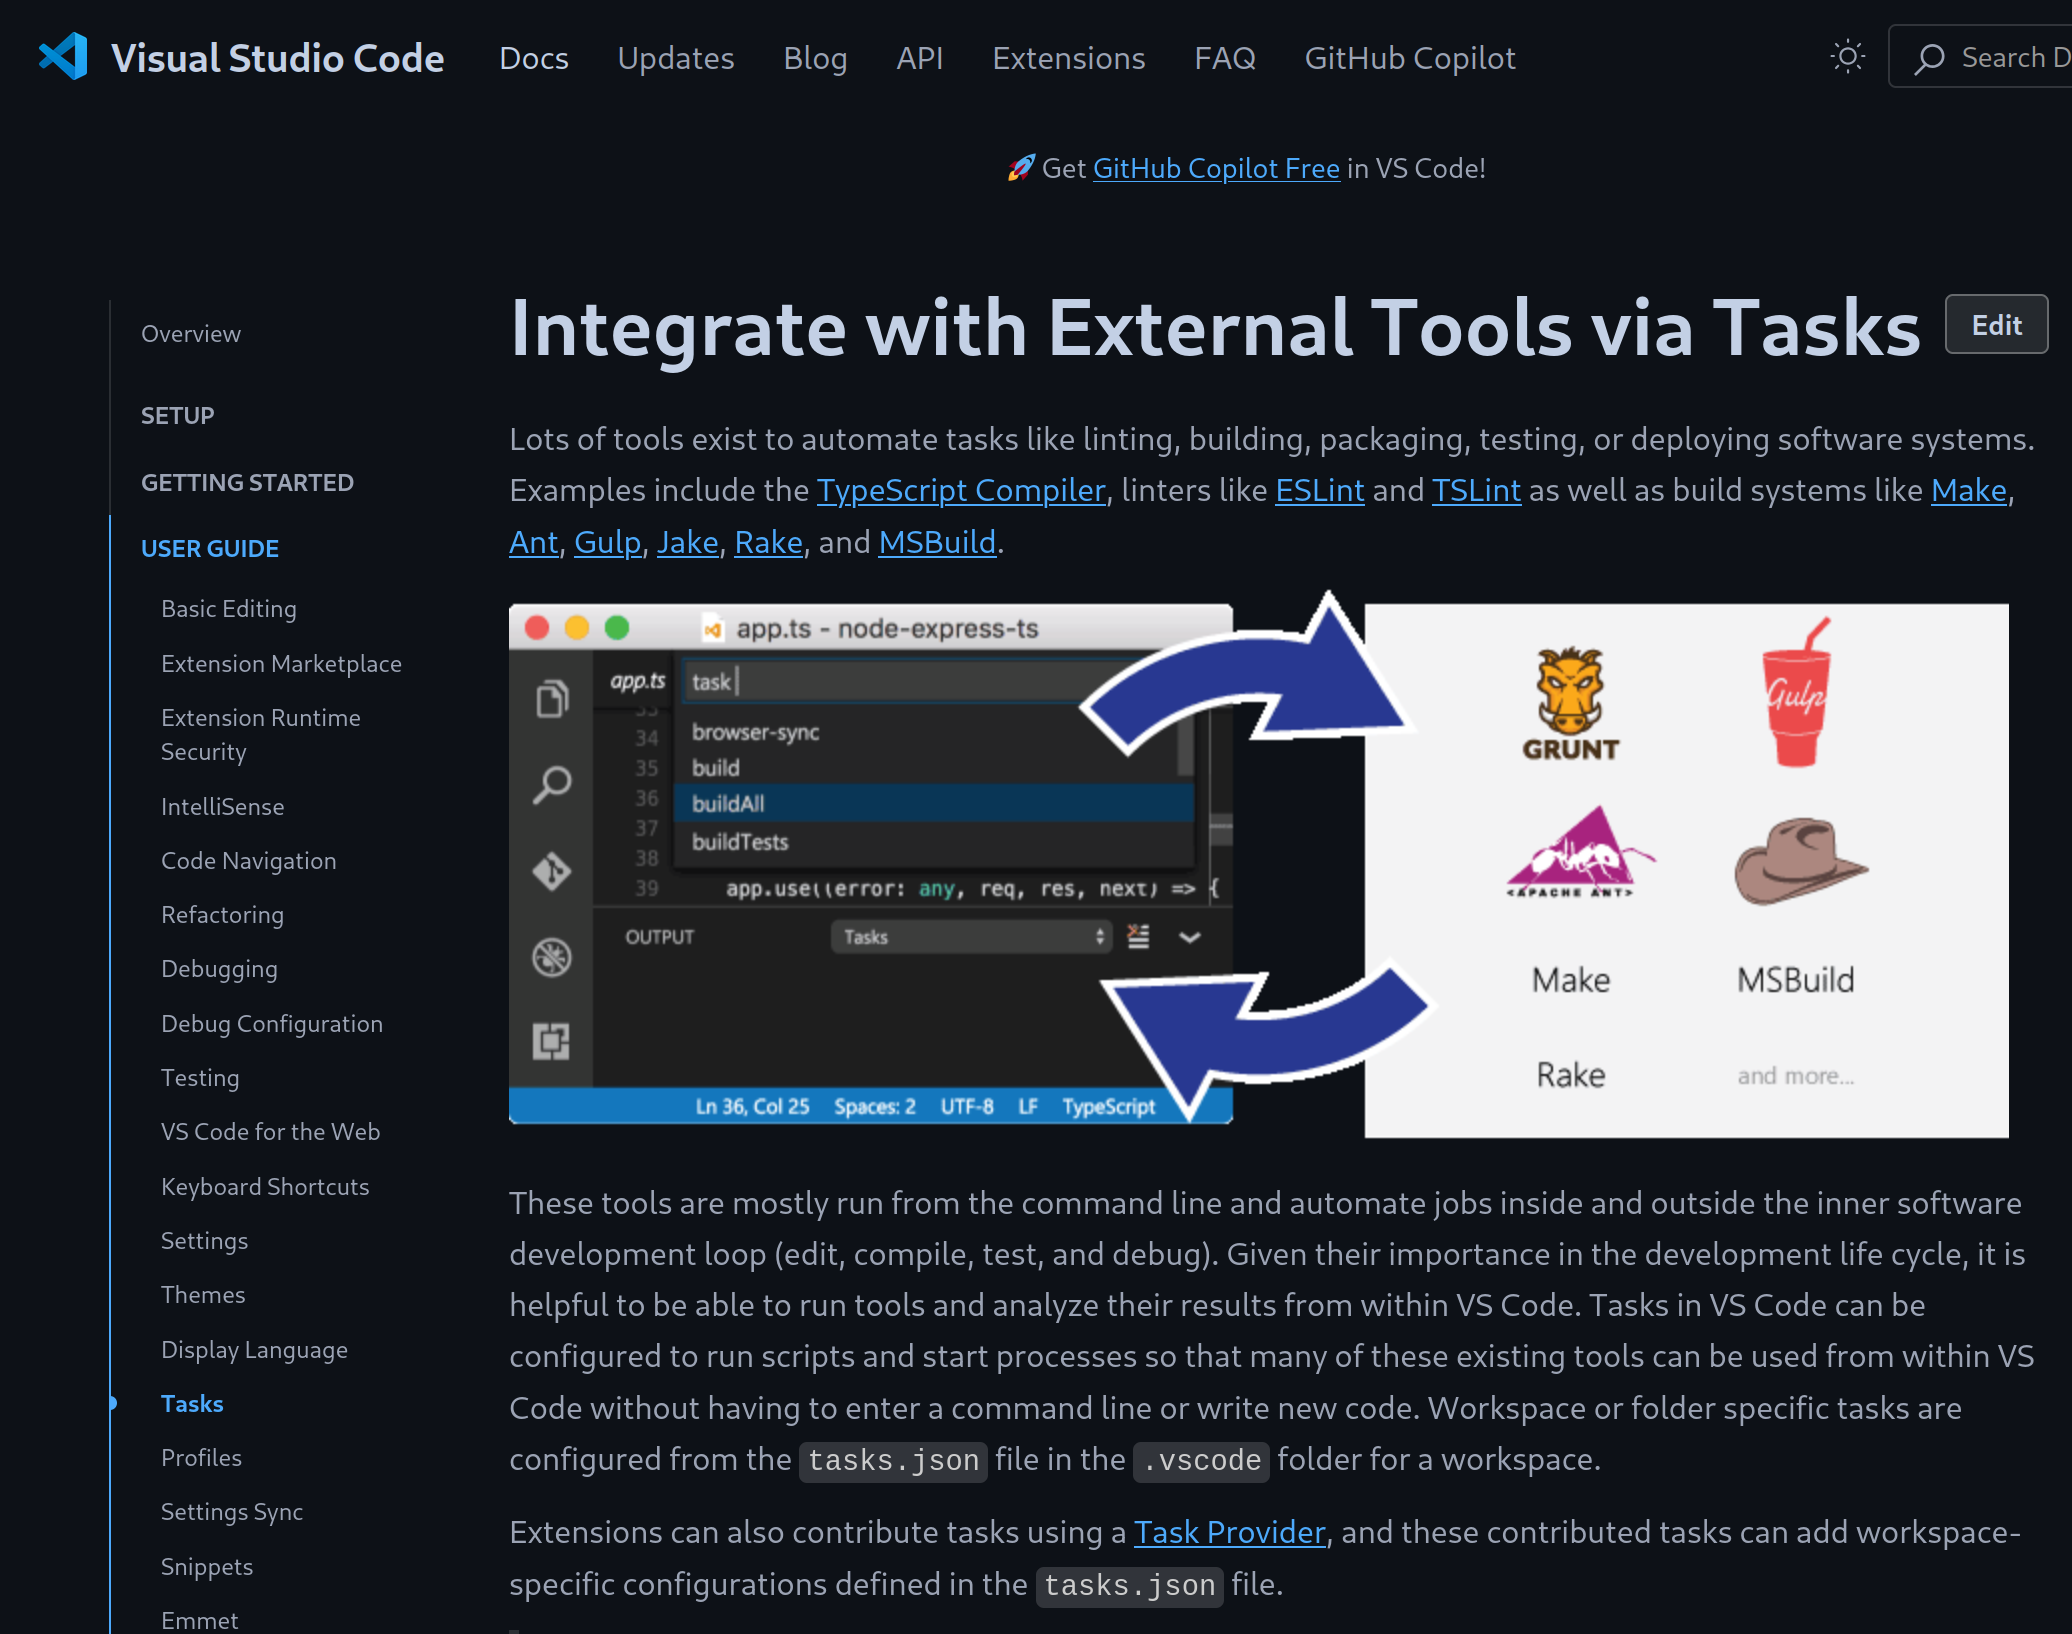
Like every code builder / IDE application, there are bound to be task-related functionalities for programmers to define an automated set of tasks that can be triggered via the click of a button instead of repeatedly typing the commands again and again.
Since all of my kernel development tools reside in the debugger VM via vagrant, I have defined a set of tasks (only for kernel exploitation development) that allows me to run the scripts listed earlier (tasks.json):
{
"version": "2.0.0",
	"tasks":
	[
		{
			"type": "shell",
			"label": "Compile exploit and launch kernel (Vagrant)",
			"command": "vagrant", // <-- your shell here
			"args": [
				"ssh", "-c", "\"cd /vagrant; bash ./recompile-exploit-run.sh\""
				]
		},
		{
			"type": "shell",
			"label": "Connect to remote gdbserver via GDB CLI (Vagrant)",
			"command": "vagrant",
			"args":["ssh","-c","gdb -ex=\"tar rem :1234\""]
		},
		{
			"type": "shell",
			"label": "Connect to remote gdbserver via GDB CLI with 1 initial breakpoint (Vagrant)",
			"command": "vagrant",
			"args":["ssh","-c","\"gdb -ex='tar rem :1234' -ex='b *${input:memory_bp}' -ex=c\""]
		},
		{
			"type": "shell",
			"label": "Unzip initramfs folder (Vagrant)",
			"command": "vagrant", // <-- your shell here
			"args": [
				"ssh", "-c", "\"cd /vagrant; bash ./unzip_cpio.sh\""
				]
		}
	],
	"inputs":
	[
		{
			"description": "Enter the address location that you want to set a breakpoint on before proceeding with GDB",
			"id": "memory_bp",
			"type": "promptString"
		}
	]


}
Bear in mind that the Vagrantfile and the scripts mentioned are all located within a single workspace, as shown in the VSCode File Explorer example here:
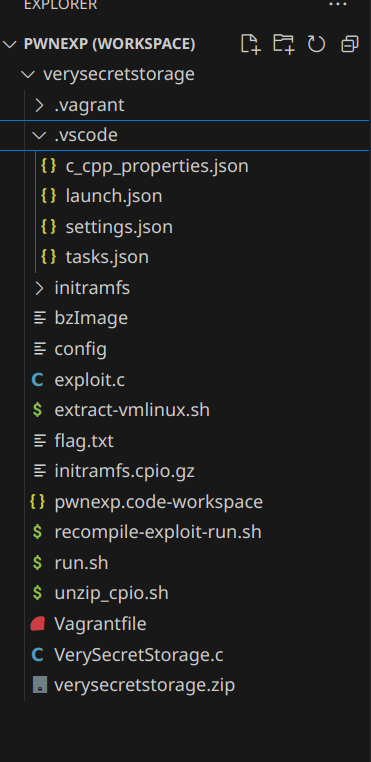
To initialise the setup, you will need to make sure that:
- All your kernel-related files such as the config, bzImage and initramfs.cpio.gz file are located in that same folder
- Run the following command to start up the Vagrant VM
vagrant upBy default, Vagrant maps all the current working directory files as a shared drive within the VM, under the location /vagrant. With that in mind, the various VSCode Tasks defined in tasks.json will work as there is no change with regards to the location of the scripts.
The Result
To test out the task, I just simply need to do the following steps (but make sure your Vagrant VM is already up before proceeding):
- Ensure that the tasks.json file is inside the .vscode folder (refer to the previous screenshot)
- Press Ctrl+Shift+P to launch the Command Palette. Click on Tasks: Run Task

- Navigate to the task Compile exploit and launch kernel (Vagrant). This will result in the Integrated Terminal showing the compilation of the exploit along with the kernel on pause until GDB is attached (as I have set it to debug mode):
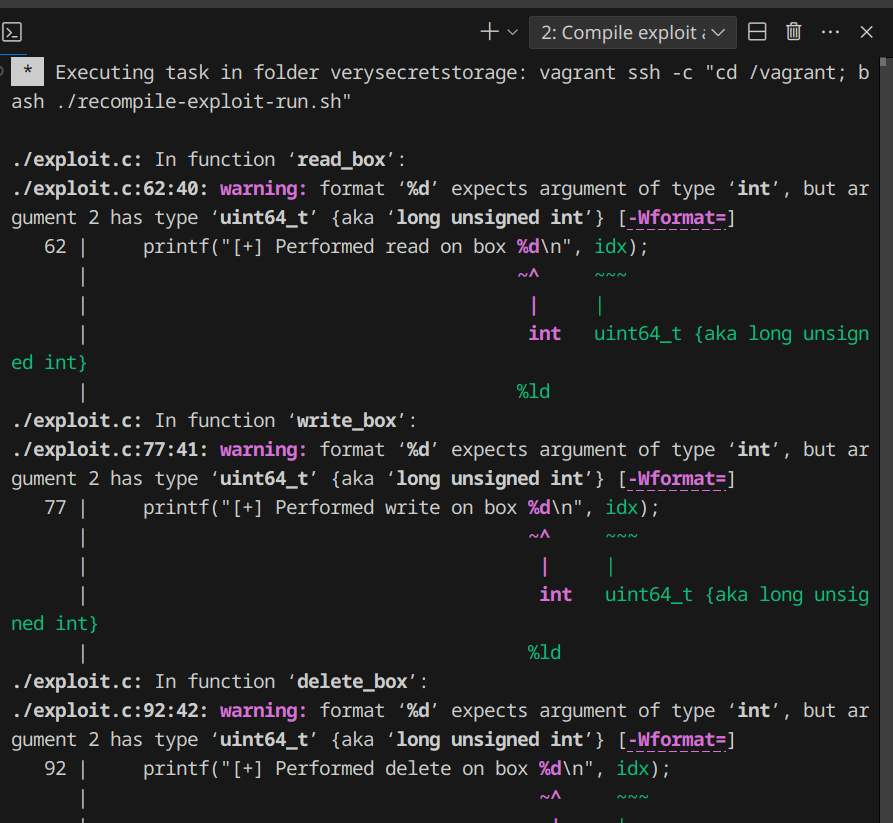
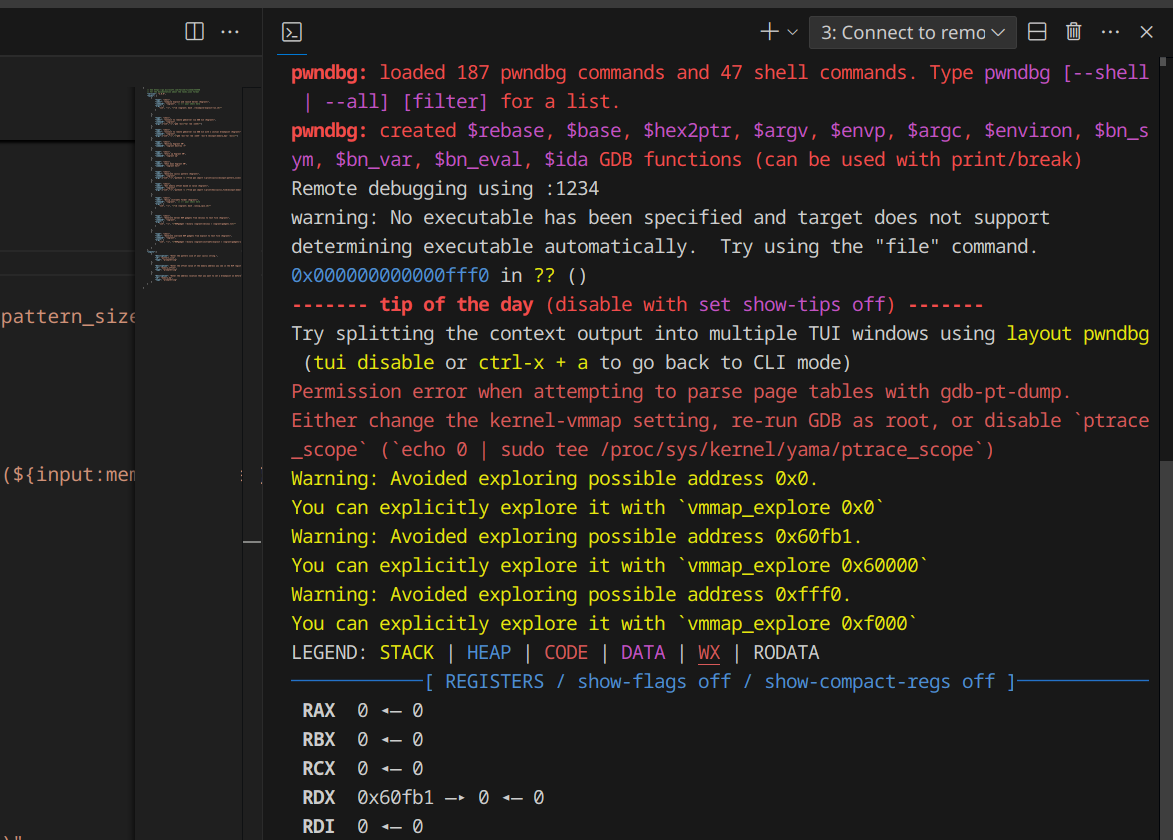
- Repeat Steps (2) and (3), but this time run the task Connect to remote gdbserver via GDB CLI (Vagrant). This will also launch another tab within the Integrated Terminal to load up GDB (for mine it’s pwndbg). Once it’s hooked, just press ‘c’ to continue with the loading of the kernel:
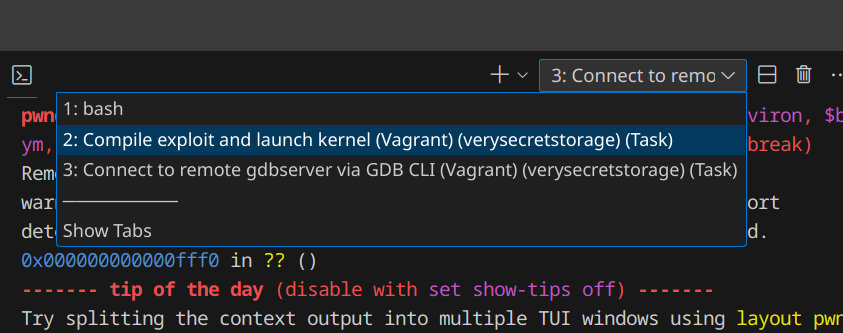
- Under the Integrated Terminal, you can switch back your Terminal interface to the task ‘Compile exploit and launch kernel (Vagrant)’:

And that’s pretty much it for the setup! Now do bear in mind that all your VS Code tasks are usually performed within the context of your workspace, so you can add on a series of other Tasks that might help you in your day-to-day work. As of now, here’s my list of Tasks that I have defined which proved to be quite useful as I was doing my kernel exploitation work:
{
    // See https://go.microsoft.com/fwlink/?LinkId=733558
    // for the documentation about the tasks.json format
    "version": "2.0.0",
    "tasks": [
        {
            "type": "shell",
            "label": "Compile exploit and launch kernel (Vagrant)",
            "command": "vagrant",  // <-- your shell here
            "args": [
                "ssh", "-c", "\"cd /vagrant; bash ./recompile-exploit-run.sh\""
            ]

        },
        {
            "type": "shell",
            "label": "Connect to remote gdbserver via GDB CLI (Vagrant)",
            "command": "vagrant",
            "args":["ssh","-c","gdb -ex=\"tar rem :1234\""]
        },
        {
            "type": "shell",
            "label": "Connect to remote gdbserver via GDB CLI with 1 initial breakpoint (Vagrant)",
            "command": "vagrant",
            "args":["ssh","-c","\"gdb -ex='tar rem :1234' -ex='b *${input:memory_bp}' -ex=c\""]
        },
        {
            "type": "shell",
            "label": "Destroy Vagrant VM",
            "command": "vagrant destroy -f"
        },
        {
            "type": "shell",
            "label": "Start up Vagrant VM",
            "command": "vagrant up"
        },
        {
            "type": "shell",
            "label": "Shut down Vagrant VM",
            "command": "vagrant halt"
        },
        {
            "type": "shell",
            "label": "Generate cyclic pattern (Vagrant)",
            "command": "vagrant",
            "args":["ssh","-c","python3 -c \"from pwn import *;print(cyclic(${input:pattern_size}))\""]
        },
        {
            "type": "shell",
            "label": "Get memory offset based on value (Vagrant)",
            "command": "vagrant",
            "args":["ssh","-c","python3 -c \"from pwn import *;print(hex(cyclic_find(${input:memory_offset})))\""]

        },
        {
            "type": "shell",
            "label": "Unzip initramfs folder (Vagrant)",
            "command": "vagrant",  // <-- your shell here
            "args": [
                "ssh", "-c", "\"cd /vagrant; bash ./unzip_cpio.sh\""
            ]

        },
        {
            "type": "shell",
            "label": "Generate kernel ROP gadgets from vmlinux to text file (Vagrant)",
            "command": "vagrant",
            "args": [
                "ssh", "-c", "\"ROPgadget --binary /vagrant/vmlinux > /vagrant/gadgets.txt\""
            ]

        },
        {
            "type": "shell",
            "label": "Generate userland ROP gadgets from exploit to text file (Vagrant)",
            "command": "vagrant",
            "args": [
                "ssh", "-c", "\"ROPgadget --binary /vagrant/initramfs/exploit > /vagrant/gadgets-userland.txt\""
            ]

        }
    ],
    "inputs":[
        {
            "description": "Enter the pattern size of your cyclic string.",
            "id": "pattern_size",
            "type": "promptString"
        },
        {
            "description": "Enter the offset value of the memory address you see in the RIP register",
            "id": "memory_offset",
            "type": "promptString"
        },
        {
            "description": "Enter the address location that you want to set a breakpoint on before proceeding with GDB",
            "id": "memory_bp",
            "type": "promptString"
        }
    ]
}
Thoughts
It’s funny that when i started this project, the main intention was more of to automate the commands/actions that i had to normally do while developing the exploit in Visual Studio Code. But now, come to think of it, this project could also be easily extended to development for the usual userland pwn activities (normal buffer overflow exploits, etc). Since the debugger environment is also on a VM (and it’s a Vagrantfile), this also means that there is a possibility to develop a standard baseline of exploit development tools for anyone who wants to dive into the world of pwn and kernelpwn. And all you need is just Visual Studio Code and Vagrant :)
I might just create a simple GitHub repository with all the necessary folder structures and the tasks defined so that anyone can clone this. But till then, hope you guys enjoy this simple yet amazing setup (i’m loving it anw):
